整形済みデータは次のようなフォーマット
- sample_data/sorted_array.json
[
  [
    "2021-02-01",
    "169"
  ],
  [
    "2021-02-02",
    "746"
  ],
  [
    "2021-02-03",
    "1267"
  ],
  [
    "2021-02-04",
    "632"
  ],
  [
    "2021-02-05",
    "401"
  ],
  [
    "2021-02-06",
    "288"
  ]
]
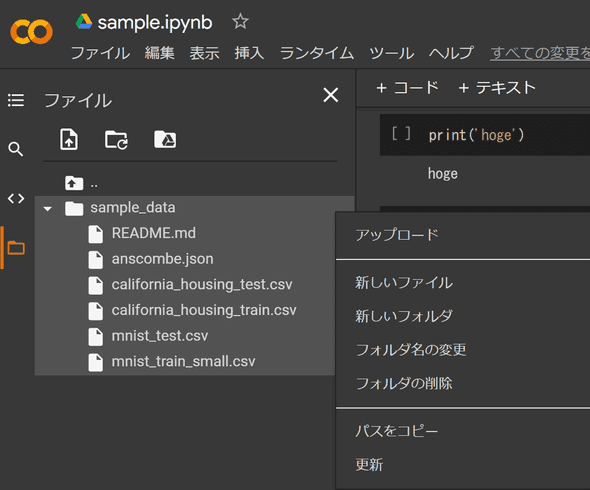
JSONファイルのアップロード
GUIで行う
ファイルをやりとりするには事前に接続しておく必要がある
実行
コードは次のような感じ
import matplotlib.pyplot as plt
import json
import pandas as pd

df = pd.read_json('sample_data/sorted_array.json')
df.set_index(0, inplace=True)

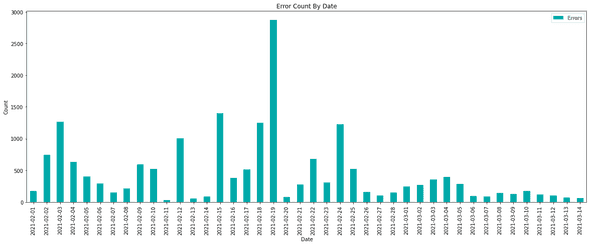
ax = df.plot(kind='bar', title='Error Count By Date', figsize=(20,7), color='#00AAAA')
ax.set_xlabel('Date')
ax.set_ylabel('Count')
ax.legend(['Errors'])
それっぽくなった
colab初めて触ったけどjupyter notebookがブラウザから簡単に使えるのかなり良い
Ctrl+Enterで実行やShift+Enterで次のコードへ遷移などjupyter notebookと同じ使い心地
あまりさわれる機会が多くないがしばらく使ってみようと思う


